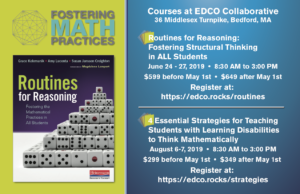
Participants will develop a deep understanding of how five research-based strategies (ask yourself questions, sentence frames and starters, annotation, the Four R’s, and turn-and-talks) can be used to help students with learning disabilities develop mathematical thinking. They will learn about six accessibility areas (conceptual processing, visual-spatial processing, language, attention, organization, and memory) math learners must use when doing mathematics. They will see how the essential strategies support students as they work in each of the accessibility areas by engaging in an instructional routine designed to develop mathematical thinking. Participants coalesce their learnings as they apply the course ideas to draft IEP goals that focus on students’ mathematical thinking.
Asynchronous from
Oct 6 - Nov 30, 2021
2 recorded synchronous sessions, Oct 27th and Nov 9th 7-8 pm Eastern
More Information

Comments are closed.
This was my third task of Capturing Quantities. Based on my previous experience with students calculating all the quantities instead of drawing diagrams, I took out the last line, “Zoe sold 36 more tickets than Minh.” We are studying ratios, and we had been working on language to express ratios as well as double number lines as a way to create equivalent ratios. Several students used the phrase, “For every ticket Minh sold, Jake sold 3 tickets” as a way to express that relationship. Many students also used double number lines when diagramming, pulling from what they had been learning in class. Based on my first two times doing this, I decided to create a sheet with the problem and the key questions this time. Some students had trouble seeing the board, and I felt that some would benefit from being able to mark up the problems. The students did seem to like this better, and they stayed focused. Since hidden relationships had come up the first two time, students tried to do that again, but it was harder during the relationships discussion to do these in their heads. They did end up identifying several of these hidden relationships when analyzing the diagrams, which led to a discussion about how diagrams can help us see new things.